Basic nilearn example
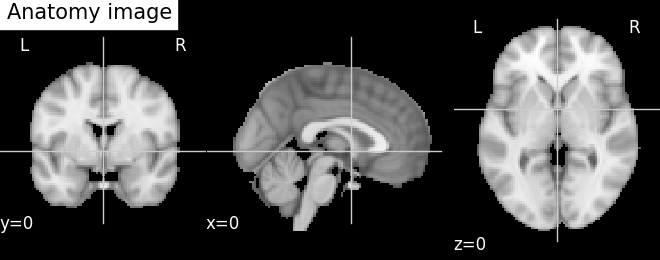
A simple example showing how to load an existing Nifti file and use basic nilearn functionalities.
Script output:
anat_filename: /home/mfpgt/Documents/PHD_research/open_source_contributions/nilearn/nilearn/data/avg152T1_brain.nii.gz
anat_data has shape: (91, 109, 91)
anat_affine:
[[  -2.    0.    0.   90.]
 [   0.    2.    0. -126.]
 [   0.    0.    2.  -72.]
 [   0.    0.    0.    1.]]
Python source code: plot_nilearn_101.py
import os
from nilearn import data

# This is just a Nifti file that is shipped with nilearn
anat_filename = os.path.join(os.path.dirname(data.__file__),
                             'avg152T1_brain.nii.gz')
print('anat_filename: %s' % anat_filename)

# Using nibabel.load to load existing Nifti image #############################
import nibabel
anat_img = nibabel.load(anat_filename)

# Accessing image data and affine #############################################
anat_data = anat_img.get_data()
print('anat_data has shape: %s' % str(anat_data.shape))
anat_affine = anat_img.get_affine()
print('anat_affine:\n%s' % anat_affine)

# Using image in nilearn functions ############################################
from nilearn import image
# functions containing 'img' can take either a filename or an image as input
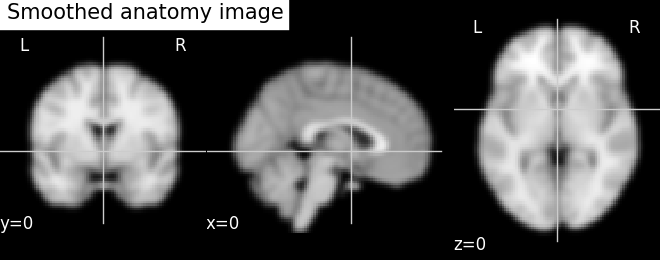
smooth_anat_img = image.smooth_img(anat_filename, 6)
smooth_anat_img = image.smooth_img(anat_img, 6)


# Visualization ###############################################################
from nilearn import plotting
cut_coords = (0, 0, 0)
plotting.plot_anat(anat_filename, cut_coords=cut_coords,
                   title='Anatomy image')
plotting.plot_anat(smooth_anat_img,
                   cut_coords=cut_coords,
                   title='Smoothed anatomy image')

# Saving image to file ########################################################
smooth_anat_img.to_filename('smooth_anat_img.nii.gz')

# Showing plots ###############################################################
import matplotlib.pyplot as plt
plt.show()
Total running time of the example: 0.91 seconds ( 0 minutes 0.91 seconds)


